¶ Pandas Dataframes
import pandas as pd
from matplotlib import pyplot as plt

#creating a dataframe
data = { 'year': [2008,2012, 2016],
       'attendees':[112,321,729],
       'average age':[24,43,31]}
df = pd.DataFrame(data)

df
| Attendees |
Average age |
Year |
| 0 |
113 |
24 |
2008 |
| 1 |
321 |
43 |
2012 |
| 2 |
729 |
31 |
2016 |
df['year`]
df[['year', 'attendees']]
|
year |
attendees |
| 0 |
2008 |
112 |
| 1 |
2012 |
321 |
| 2 |
2016 |
729 |
earlier_than_2013 = df['year'] < 2013
df[earlier_than_2013] #boolean indexing
|
attendees |
average age |
year |
| 0 |
112 |
24 |
2008 |
| 1 |
321 |
43 |
2012 |
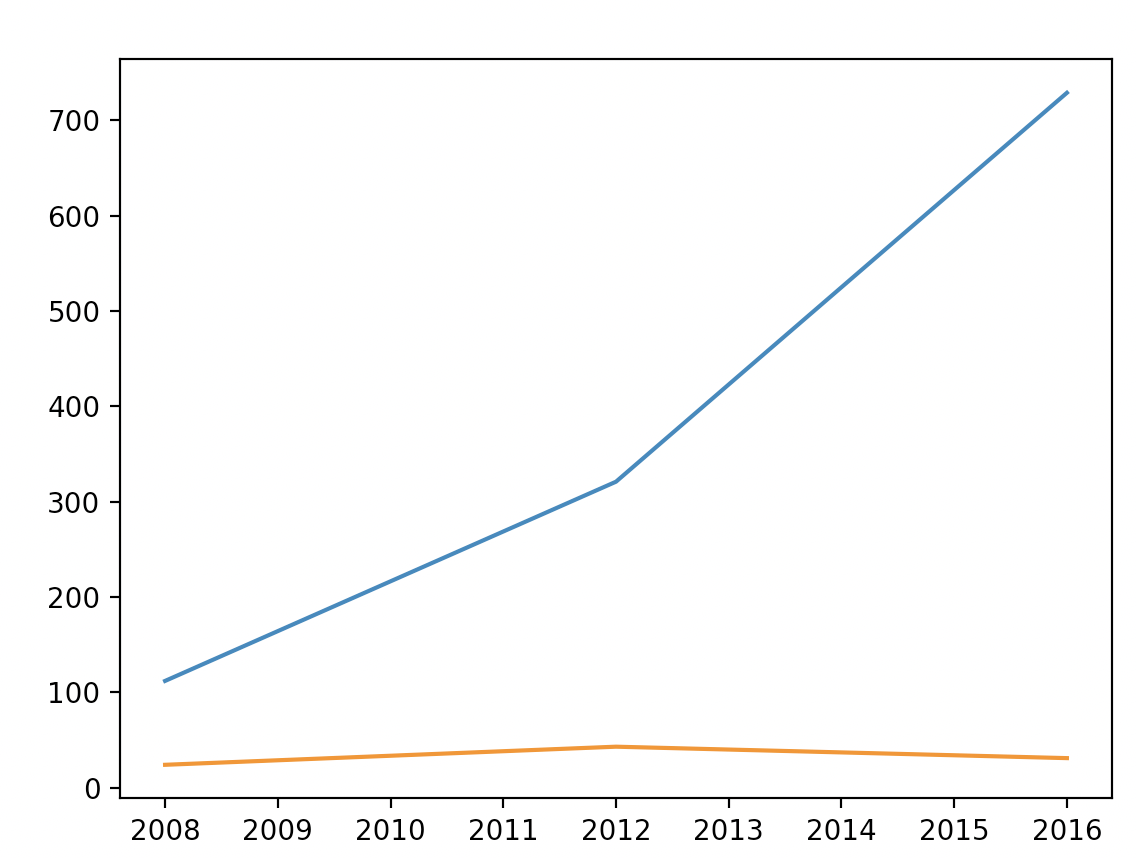
plt.plot(df['year'], df['attendees'])
plt.plot(df['year'], df['average age'])
plt.show()
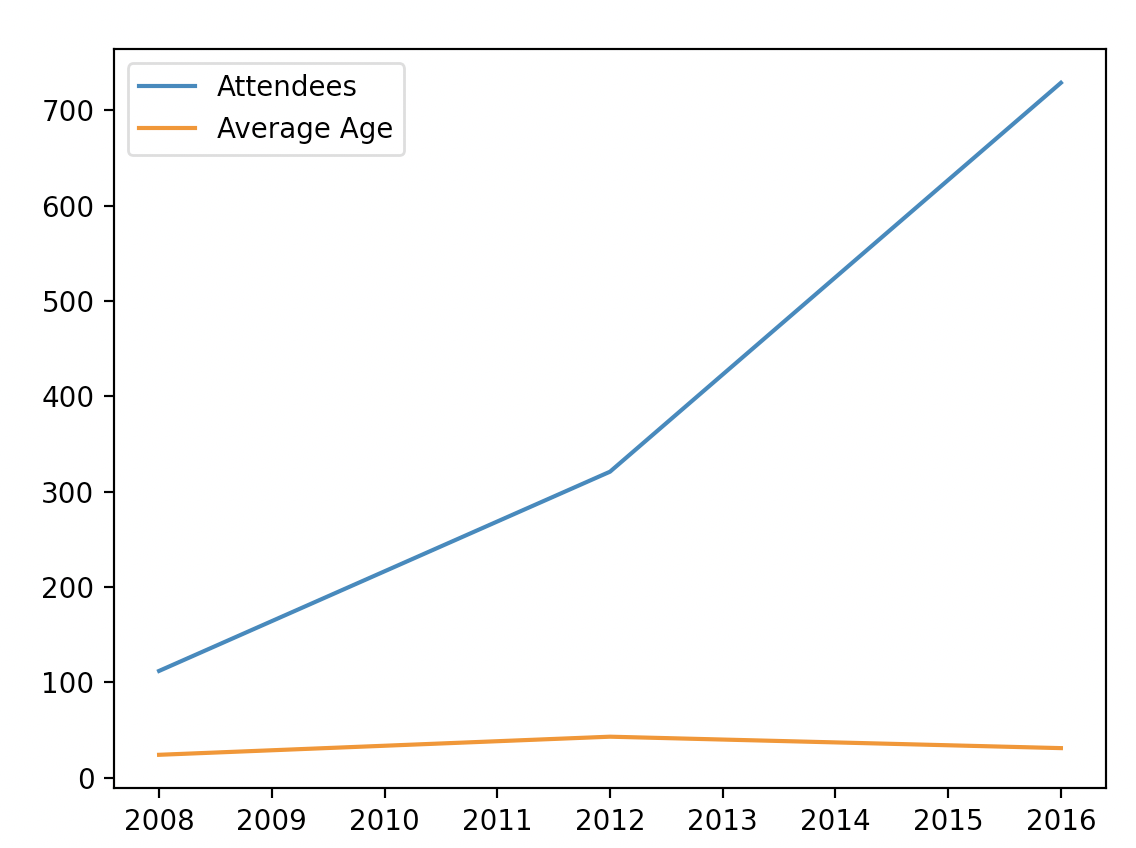
plt.plot(df['year'], df['attendees'])
plt.plot(df['year'], df['average age'])
plt.legend(['Attendees','Average Age'])
plt.show()